High-resolution ion mobility combined with high-resolution QTOF mass spectrometry provides enhanced peak capacity for clearer and deeper insights into your sample. Furthermore, the post-processing software of timsTOF allows interactive data inspection so you can take a closer look at interesting areas that emerge from your analysis.
Use DataAnalysis 5.0 to visualize results from your analysis in a heatmap. You can then select and enlarge a section of that heatmap and acquire a second or third data file of the same sample and use the unique imeX technology to adjust the ion mobility resolution of timsTOF for more detailed insights.
timsTOF features an open data format (*.tdf), which allows you to integrate results from the instrument into applications that support your research and to create your own open software tools to analyze results exactly as you want to. The simple structure, standardized format, and straightforward access of data files acquired with timsTOF makes it easy to design more relevant analyses, create software tools that carry out innovative data processing, visualize data in new formats, and report results in meaningful ways.
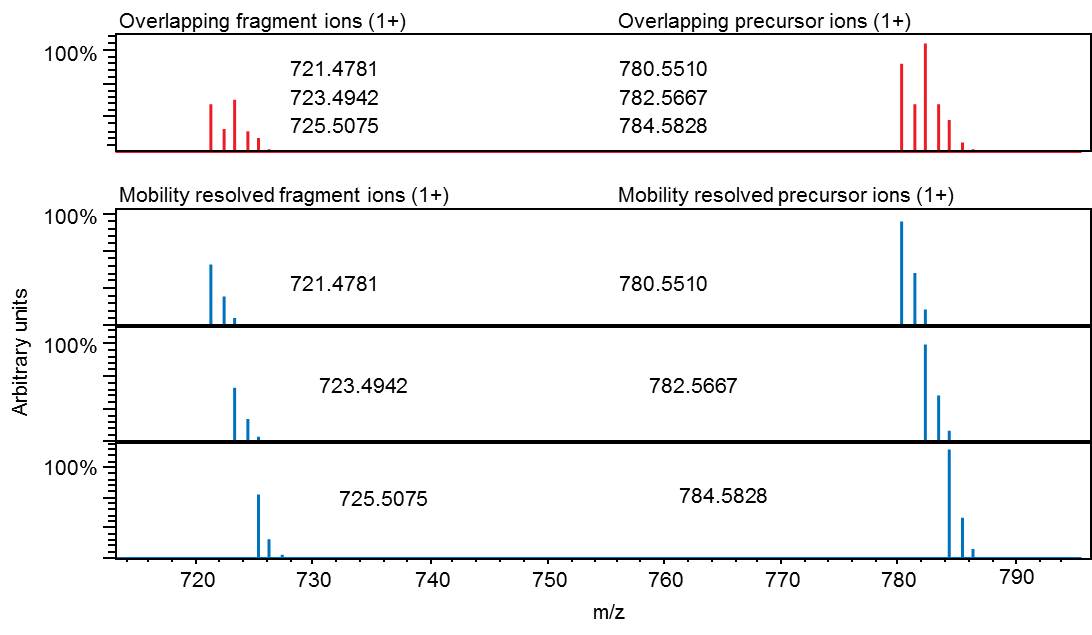
Interpretation of MS/MS spectra is often complicated by unintentional contamination of a fragmentation event when more than one precursor ion is in the quadrupole isolation window. As a result, fragments analyzed are a mixture belonging to two or more compounds which can prevent unambiguous identification.
timsTOF eliminates this problem, because ion mobility separation provides MS/MS spectra with significantly less background noise. These clean spectra are easier to interpret, allowing more confident and specific identifications.
timsTOF can be used with or without separation by Trapped Ion Mobility Spectrometry (TIMS). That is, the instrument can be used as a powerful high-resolution QTOF mass spectrometer. In many situations, such an instrument accomplishes the goals of an experiment. When, however, a research question demands enhanced separation of sample components and increased peak capacity, a researcher with a conventional QTOF mass spectrometer must resort to optimizing the online separation by, for example, using a different chromatography method or column materials. With timsTOF, that added separation power is available at the flip of a switch.
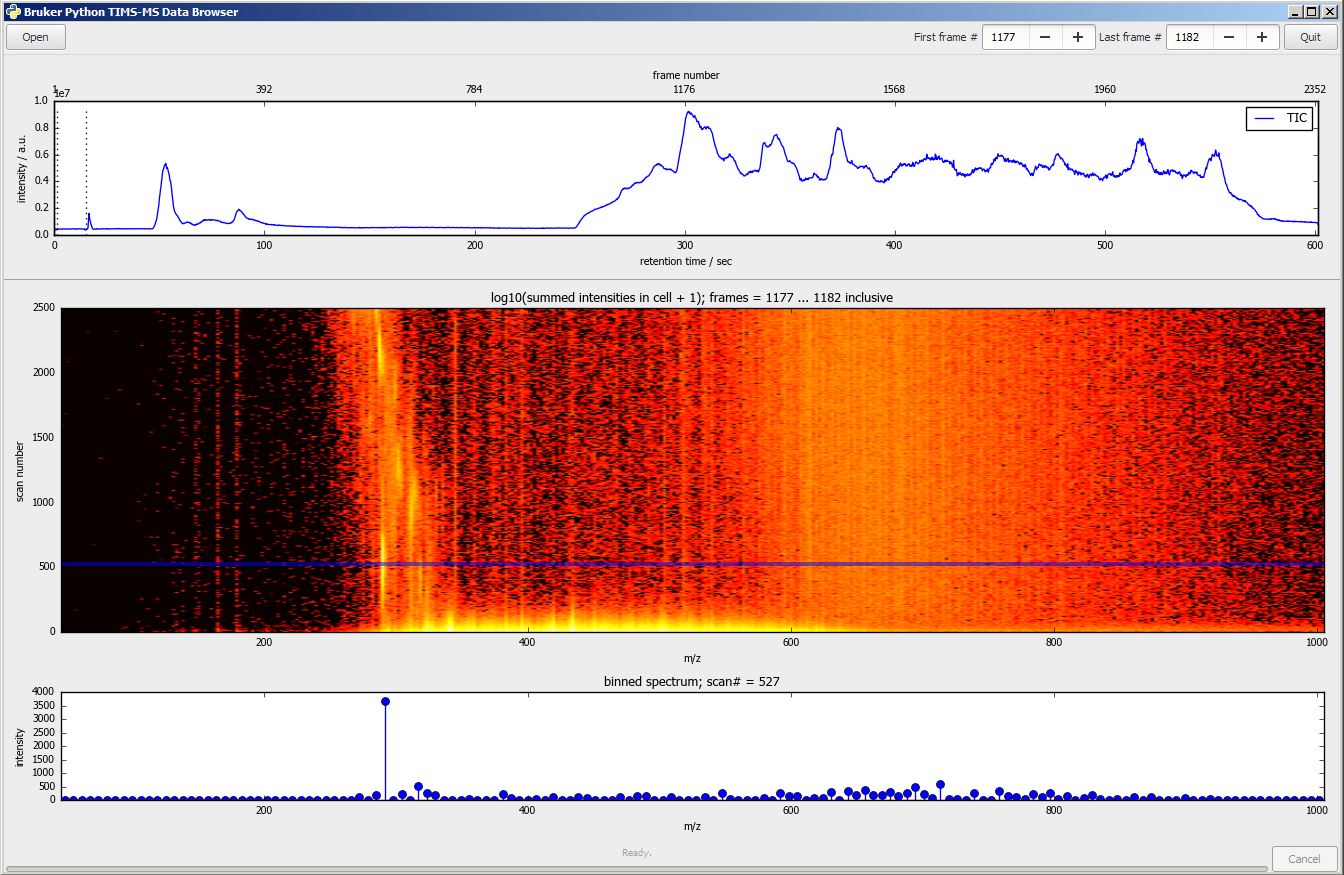
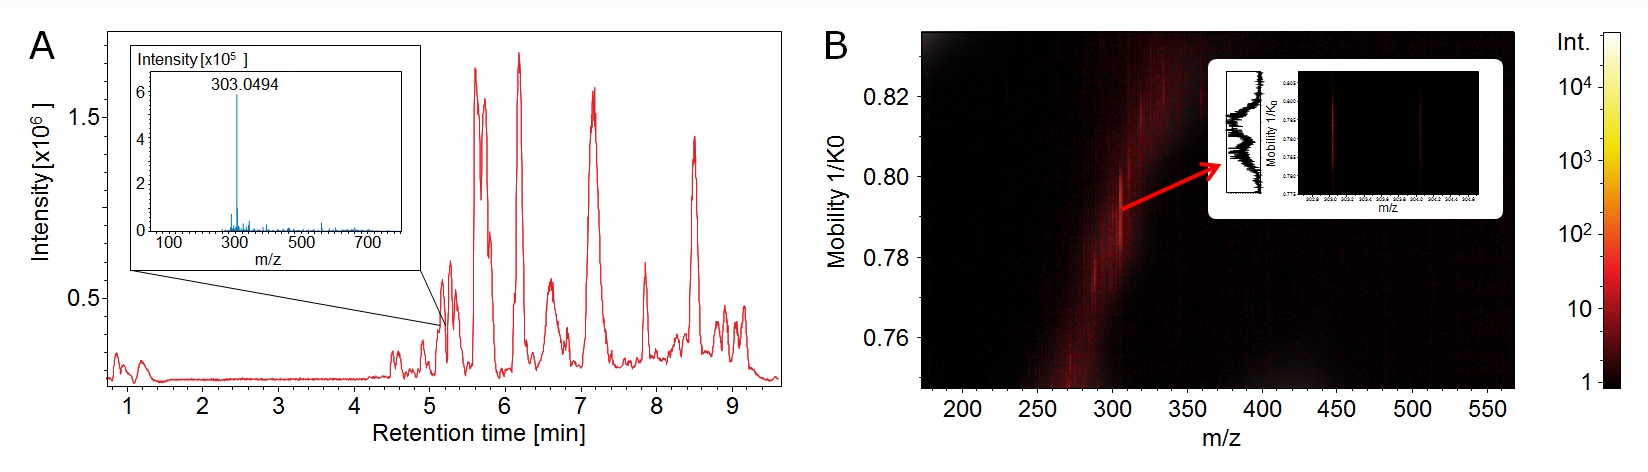 Figure 4. A. The analysis of complex samples does often not reveal all details. The averaged mass spectrum shows one main compound at a retention time 5.1 min (insert). B. TIMS enabled for an additional dimension: heatmap display reveals a broad peak in the mobility domain. The mobilogram confirms a double peak and thus two isomeric compounds (insert).
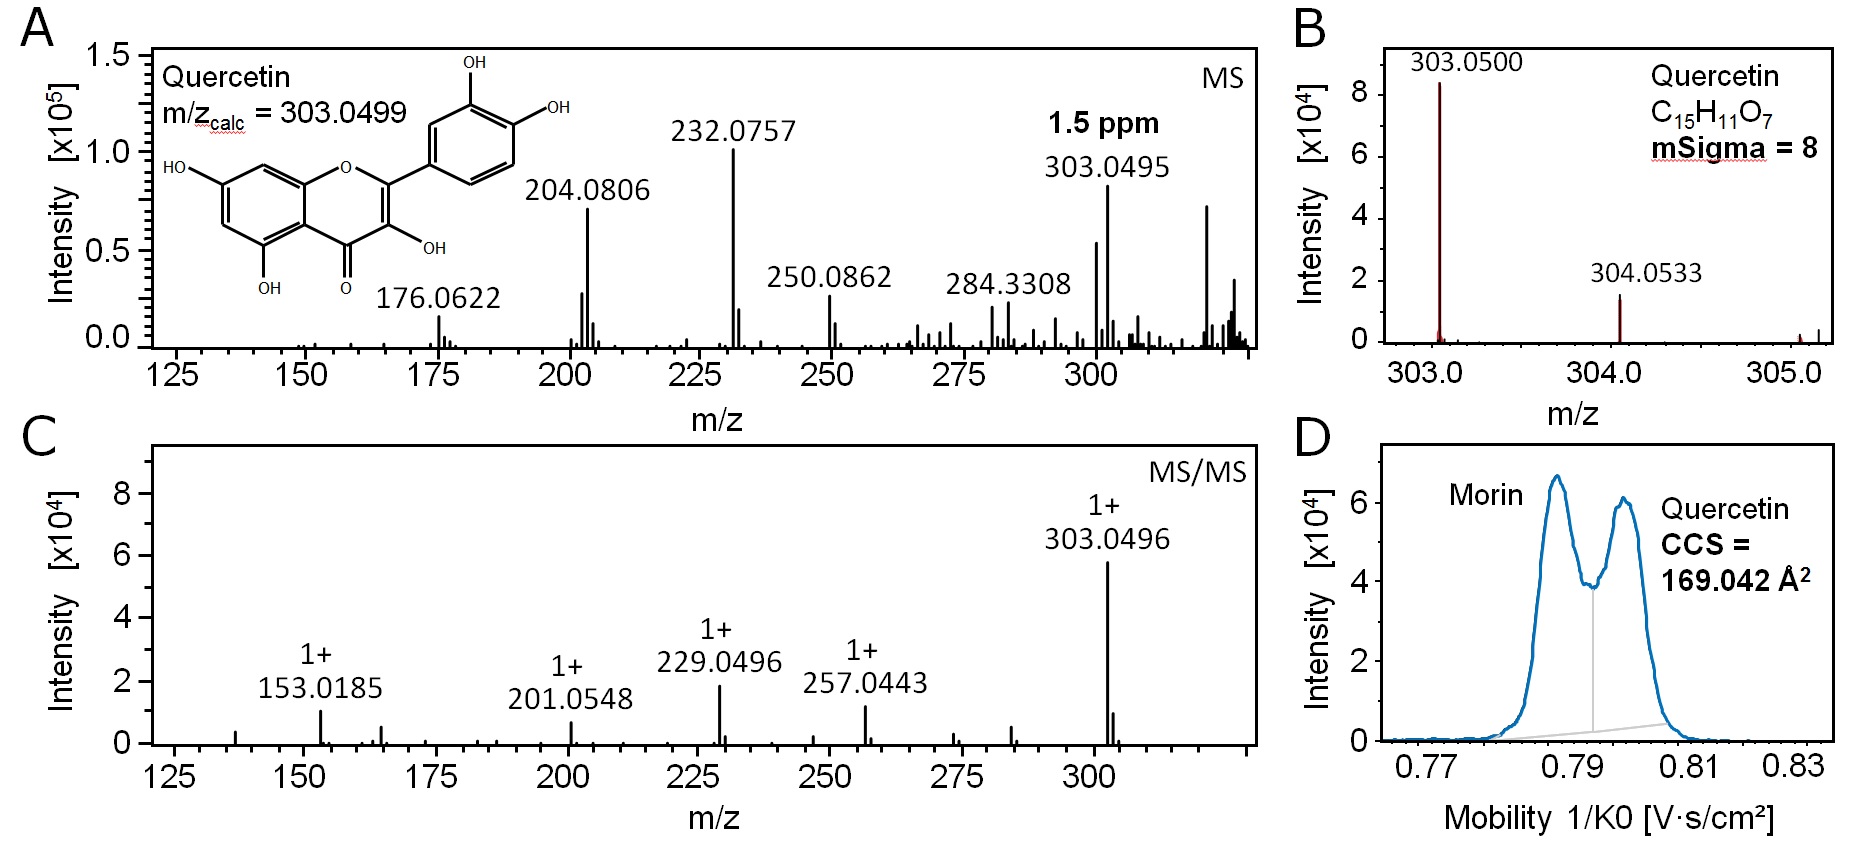
Some compounds, such as structural isomers, simply cannot be resolved with mass spectrometry alone. Identifying such substances in a sample calls for an additional qualifier that can be used to confidently distinguish one ion from another. With timsTOF, you can build enhanced libraries where each compound is characterized by ppm mass accuracy, collisional cross section (CCS) with a precision of < 0.5%, Bruker's unique isotopic pattern fidelity (True Isotopic Pattern or TIPTM), and fragmentation patterns. Using these orthogonal characteristics improves the confidence and specificity of identifications.